Article Text

Abstract
Objective This paper examines the relationship between bicycle collisions and the amount of cycling at the local level. Most previous research has focused on national and city comparisons, little is known about differences within a city (the mesoscale).
Methods This study mainly used three types of data sets relating to bicycle collisions, use of bicycles and local neighbourhood characteristics in Hong Kong. In particular, bicycle usage, measured as bicycle-kilometres travelled, was estimated from travel surveys following the activity-based approach. Negative binomial regression models were established to model the relationship between the amount of cycling and the occurrence of bicycle collisions at the spatial scale of the Tertiary Planning Unit, which is the smallest planning unit of the city.
Results The numbers of bicycle collisions went up with the increasing use of bicycles, but the increase in the number of collisions in a given community was less than a linear proportion of the bicycle flow. When other local neighbourhood variables are controlled, the amount of cycling is a statistically significant variable in accounting for the number of collisions.
Conclusions Even in a highly motorised city where bicycles are a minor transport mode, cyclists are less likely to be involved in road collisions in communities with higher cycling volume. Since cycling activities are likely to vary within a city, a more local-based approach in promoting cycling is needed. In particular, the higher safety risks in neighbourhoods of low bicycle usage, especially at an initial stage of promoting cycling, need to be addressed properly.
This is an Open Access article distributed in accordance with the Creative Commons Attribution Non Commercial (CC BY-NC 4.0) license, which permits others to distribute, remix, adapt, build upon this work non-commercially, and license their derivative works on different terms, provided the original work is properly cited and the use is non-commercial. See: http://creativecommons.org/licenses/by-nc/4.0/
Statistics from Altmetric.com
Introduction
The increasing concern about global warming and environmental degradation has highlighted the importance of environmentally sustainable transport.1 Since cycling has great potential in reducing carbon emissions and noise levels when compared with travelling by car, it is widely considered as one of the most environmentally sustainable transport modes.2 ,3 As an active mode of transport, cycling is also regarded as an excellent way to benefit public health as a form of vigorous physical activities.4 Nonetheless, cyclists are more vulnerable to traffic injuries than other road users such as car drivers because they are less likely to be protected by their vehicles. As the benefits of cycling can be outweighed by problems of safety and the lack of an adequate infrastructure,5 efforts have been paid to making bicycle use safer.
In dealing with the cycling safety issue, one needs to figure out what ‘safety’ means before performing any analysis. Does the fact that there are no cyclists injured on a road necessarily mean that the road is safe for cycling? The reason for no cycling casualties can simply be that no one is cycling there. In this light, cycling safety is better measured as risk, where cycling exposure or the volume of cycling on the road is properly considered. In recent decades, a number of studies suggested a phenomenon called ‘Safety in Numbers (SIN)’ for cyclists.6–13 For instance, Jacobsen7 concluded that a motorist was less likely to collide with a cyclist or pedestrian if more people cycled and walked. Focusing on single-bicycle crashes, Schepers8 found that the risk of severe injury was also lower in municipalities with a high amount of cycling. Vandenbulcke et al9 confirmed that high proportions of commuter cyclists are correlated with low risks of becoming a casualty at a regional level within Belgium.
Most previous studies on SIN for cyclists, however, performed the analysis only at the macrolevels such as cities, regions and countries,6–10 or microlevels such as individual intersections and road segments.11–13 Few research efforts have been dedicated to the investigation at a zonal or neighbourhood level within a city. To help road safety administrations to gain a better understanding of the safety effects of increasing cycling at different spatial scales, it is necessary to focus on bicycle collisions within a city at a neighbourhood level and examine the relationship between the amount of cycling and the likelihood of bicycle collisions.
Regardless of the different approaches used in analysing bicycle collision risks, exposure is an essential factor that should be taken into account in risk modelling.14 In the literature, there is no consensus on the best way to measure bicycle exposures. Prevailing exposure measures include time spent on cycling, number of bicycles passing the crossings, number of cycling trips taken and distance travelled calculated from the number of passages or from the mapping of cycling routes by survey respondents based on questionnaires.13 ,15–18 Recently, Global Positioning System (GPS) data have enabled researchers to gain accurate and precise cycling exposure data, but they are very costly and hence have hardly been used for obtaining cycling flow in the whole territory of a city. Although advanced information technology, notably the ‘big data’, also has great potential for deriving cycling use within a city from various types of data, it is currently not capable of providing a territory-wide picture of bicycle flow due to limited empirical data availability. In the absence of consistent cycling exposure data within a city, cycling safety at the local level cannot be modelled appropriately. In this study, an activity-based approach is introduced to measure cycling exposure at the local level. This method relies on an individual's travel and/or activity diary,19–21 which allows us to map daily trajectory of each person. Based on the travel information, routes for a specific transport mode are extracted for measuring exposure. The method was first proposed for the measurement of pedestrian exposures19–21 and has, to the authors' best knowledge, not been applied to the study of SIN or the cycling safety research. Once again, SIN has been systematically examined at international, national, and regional levels, but it has never been investigated across all communities within the same city. Will SIN for cyclists apply at the local level across the whole territory of a city? Answer to this question is particularly important for highly motorised cities, where bicycles are still a minor transport mode and that the safety risk of cyclists is notably higher both in eyes of other road users and the road safety administrations. Therefore, this research is of theoretical significance in studying SIN at the mesoscale and of practical significance in informing policy makers by emphasising the importance of local context.
In relation, the objectives of this study are (1) to examine SIN for cyclists within a city at the local level and (2) to illustrate the method and value of extracting cycling exposure data from travel surveys following an activity-based approach at an individual level. Hong Kong is chosen as the study area, where 10.4% of the households had bicycles available for use.22 Bicycle activities, however, vary substantially over the city. The proportion of bicycle usage is much higher in the new towns and New Territories than the dense urban area.22–24 As the local environment such as topography and cycling facilities can vary significantly within a city, it is worth exploring SIN across different neighbourhoods.
The following section will introduce the research methodology. Following the data description, the way in which cycling exposure is calculated will be presented in details. Next, negative binomial regression models for modelling bicycle collisions (ie, collisions involving bicycles) will be introduced. The model results will then be presented and discussed, followed by conclusions and further research directions.
Methodology
Data sources
The bicycle collision data are derived from the Traffic Road Accident Database System collected by the Hong Kong Police every year. Only traffic collisions with injury were recorded in the database. In Hong Kong, the degree of collision underreporting was comparable with other developed countries.25 Property damage-only bicycle crashes are not recorded in the database. Many of them are single-bicycle crashes, that is, not involving any other bicycle or vehicles. An international overview (including Hong Kong) of the importance of single-bicycle crashes has been given by Schepers et al.26 With geographical coordinates recorded in the database, the collisions are first plotted onto a map and then geovalidated by a geovalidation procedure.27 As rare events, traffic collisions happening at a certain location may be due to randomness. To ensure a more representative bicycle collision samples, this study pools data for the study periods of 3 years rather than 1 year. To examine whether SIN for cyclists can be identified consistently over time, bicycle collisions happening in two periods (the period from 2001 to 2003 and the period from 2010 to 2012) are chosen for the analysis.
The principal database for constructing the activity-based cycling exposure factors is the Travel Characteristics Survey collected by the Transport Department of Hong Kong. It provides information on the characteristics of daily activity–travel patterns of respondents during weekdays. The respondents were asked to recall all types of activities they took and transport modes by which they travelled to fulfil activities on the preceding non-public-holiday weekday. Based on the vehicular counts on the roads, motorised trips have been corrected for the under-reporting due to the recall gap.22 ,23 However, as there are no territory-wide walking or bicycle counts, these travel survey data cannot be corrected for the under-reporting or recall gap in the same manner as the motorised traffic. The study relies on two Travel Characteristics Survey data sets collected in 2002 and 2011. The former was conducted between 10 September and 21 December 2002 with a total of 30 005 households (1.4% of the population) and the latter was undertaken between 5 September 2011 and 18 January 2012 with totally 35 401 households (1.5% of the population) successfully enumerated.22 ,23 They represent the latest travel characteristics data available in the city. Moreover, Hong Kong is having subtropical climate that the average monthly temperatures from September to December were 17°C–28°C. Hence, the weather of the survey periods is suitable for cycling.
In this study, bicycle collisions are analysed at the Tertiary Planning Unit (TPU) level, which is the smallest unit for planning purpose in Hong Kong. This research uses TPU maps provided by the Hong Kong Planning Department in 2001 and 2011. The descriptive statistics on the size of TPUs are shown in table 1. Figure 1 delineates the boundary and population density of the TPU system in a year. Bicycle collisions are analysed at the TPU level because the TPU system is also used in the city's population census conducted every 10 years. Using TPU as our spatial unit of analysis, it is possible to consider other socio-economic influence in our model.
Descriptive statistics on tertiary planning unit size in terms of area and population

Population density in Hong Kong by TPU, 2001 and 2011.
Measurement of cycling exposure
In general, activity-based measures can be categorised into two types, namely space–time path (STP) and potential path tree methods.19 ,20 ,28 Although it is found that both approaches are useful exposure estimates, the former is superior because it measures exposure in a more efficient manner.19 In this light, this study estimates the cycling exposure measured as bicycle distance travelled by following the STP method.
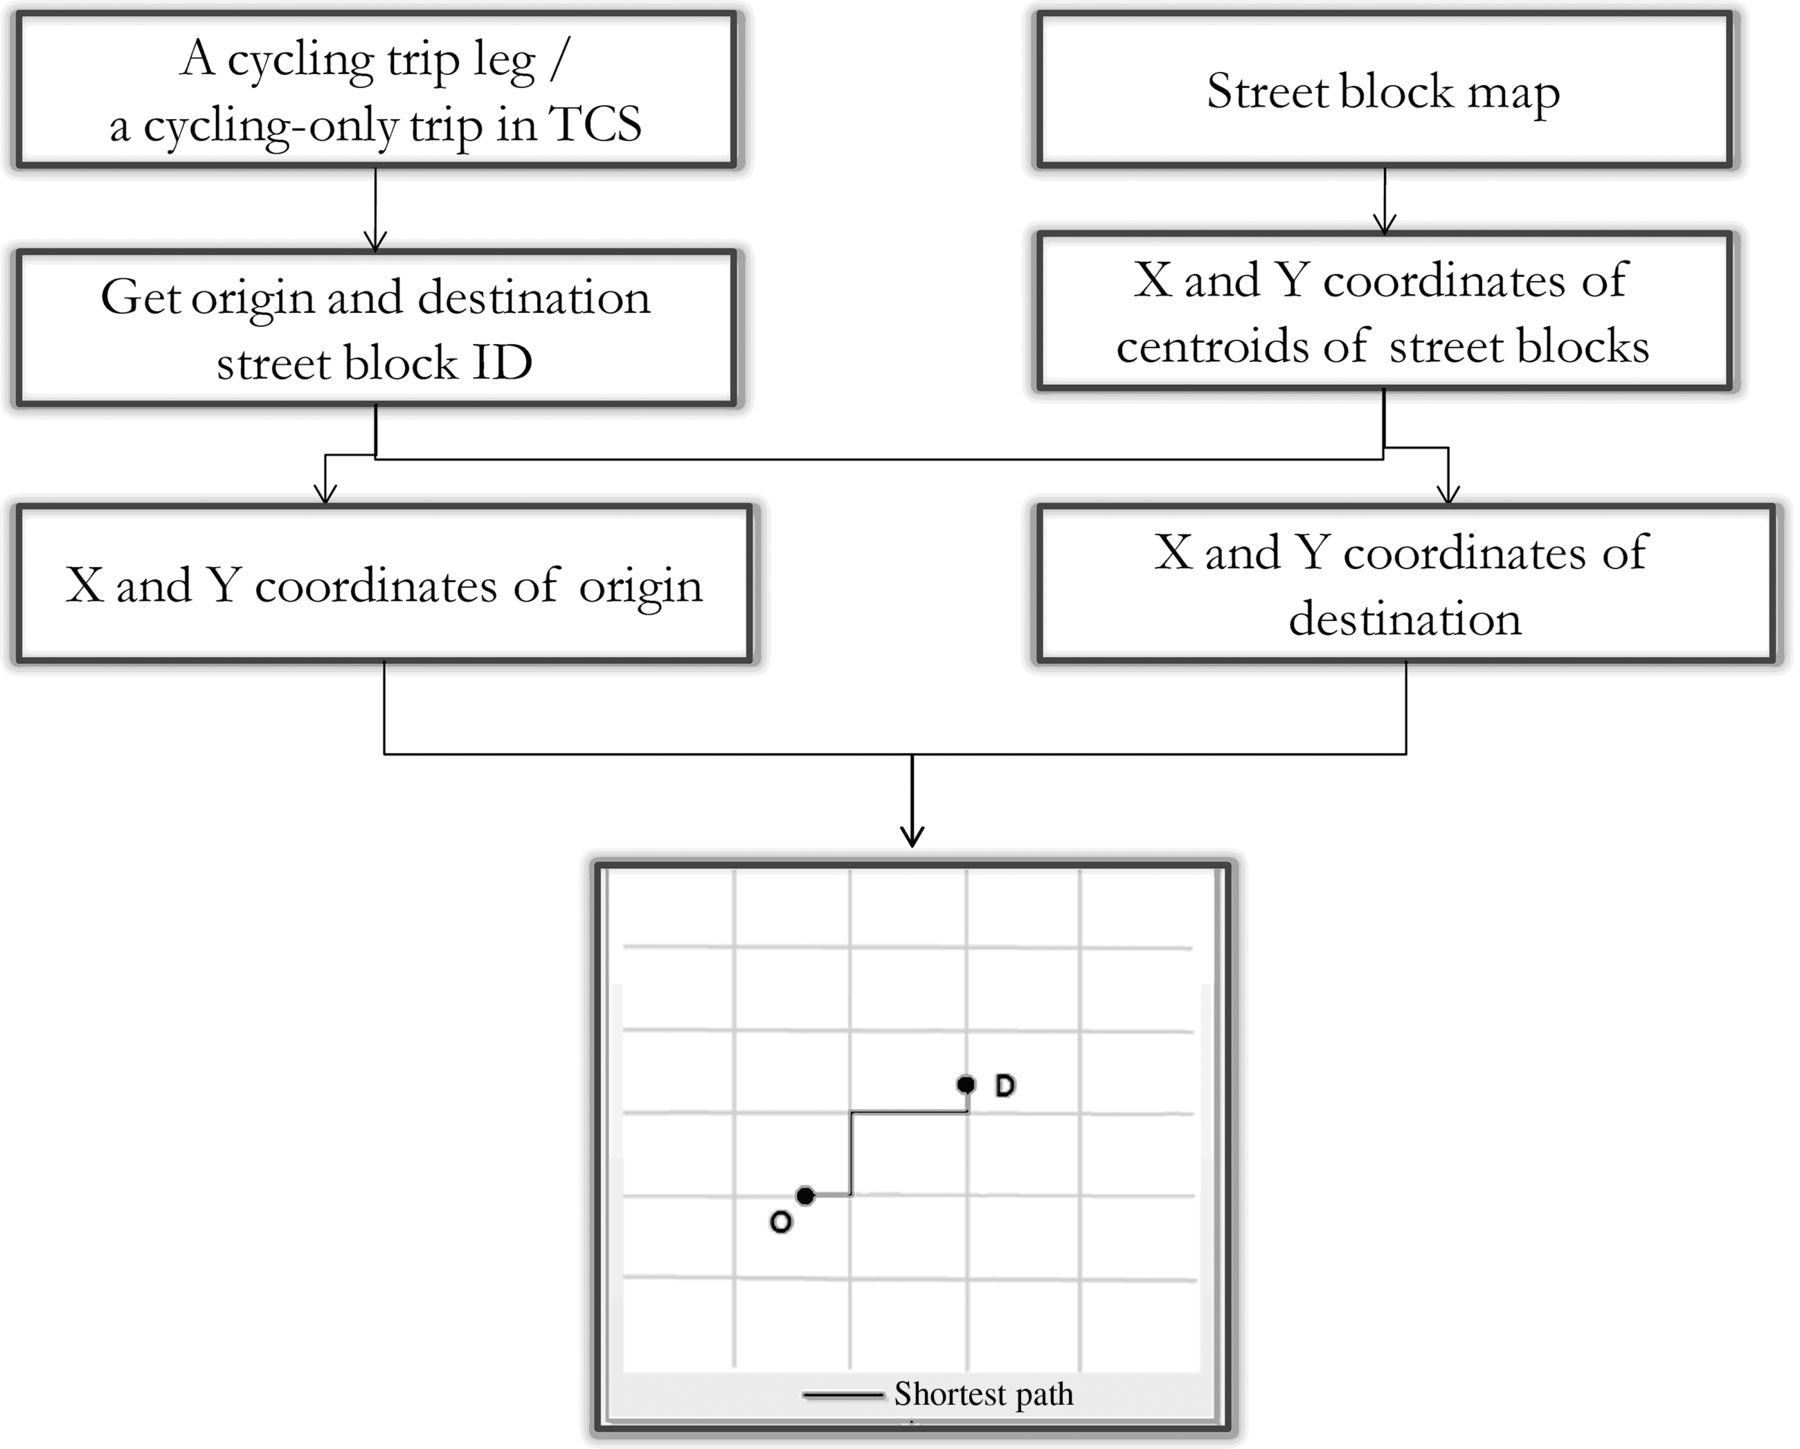
The STP approach relies on the shortest path between an origin and a destination of a trip recorded in a travel and/or activity dairy. Figure 2 is a flow chart illustrating the major procedures of deriving cycling STPs from the travel survey databases. Cycling-only trips and cycling trip legs are first identified from the database. The detailed locational information on origins (O) and destinations (D) is reported at the level of street blocks, of which the centroids are treated as locations where a trip/trip leg started or ended. In Hong Kong, there are about 5000 street blocks in the whole territory, with an average area of 0.22 km2. With the geographic coordinates of the centroids of street blocks, the origin and destination for each trip/trip leg are plotted on the map. With the OD pairs, cycling STPs are calculated by performing the shortest path algorithm in ArcGIS 10. The STPs are then overlaid with the TPU maps to extract the part of routes within the boundary of each TPU. By aggregating routes, the cycling exposure is generated by TPU.

Flow chart for generating bicycle exposure.
Due both to sampling and non-sampling errors, the Travel Characteristics Surveys (like most other surveys) could not achieve proportionate sampling of different strata of the target population. The household expansion factors are statistical weightings used to correct for the bias of oversampling and undersampling of different subgroups.22 ,23 ,29 By taking the household expansion factors into account, the cycling exposure estimated from the Travel Characteristics Surveys 2002 and 2011 was calculated as 140 790 and 127 140 bicycle-km, respectively. Nonetheless, under-reporting due to recall gap or other factors like social desirability cannot be corrected by the household expansion factors.25 Should observed bicycle counts be available, further validation needs to be conducted.
Model
Collision prediction models are used for collision analysis at the TPU level. The association between cycling exposure at the TPU level and the number of collisions is estimated by controlling for a set of factors such as motor vehicle flow, land use and demographic characteristics. In this research, a negative binomial regression model is built in a similar way of the model form by Schepers8 as: 1where BCollision is the number of collisions at TPU i; Z is a set of TPU-based characteristics as control variables, β2 is the corresponding set of parameters and BDist is cycling exposure measured as bicycle distance travelled. In the equation above, when 0<β1<1, it suggests that the increase in bicycle collisions with increasing bicycle flow is less than linear.
Variables
The traffic collision databases from 2001 to 2003 and those from 2010 to 2012 were pooled into two 3-year period data sets, respectively. As the travel survey was undertaken on weekdays, bicycle collisions happening on weekends and public holidays on weekdays were excluded.
Apart from bicycle exposure, previous research also found demographic and built environmental factors important in affecting cycling safety, which have been comprehensively reviewed in the work by Vanparijs et al.14 In this research, some demographic and built environmental factors will be introduced as control variables into the bicycle collision models. To select appropriate variables among various indicators, the variance inflation factor (VIF) was computed to check for interdependency. All the VIF values were in the range from 1 to 3.7 for each period, indicating small collinearity.30 Table 2 presents the variable names and some brief descriptions as well as the data sources, and table 3 shows the descriptive statistics of each variable for both periods. The vehicle flow data are derived from recorded vehicle flow on counting stations installed by the Transport Department of Hong Kong. Every year, the Transport Department publishes the vehicular flow data in its Annual Traffic Census reports. Land use data are obtained by digitising land use paper maps provided by the Lands Department. The demographic and socioeconomic data are collected from various Hong Kong Census reports.
Name, description and data source of variables
Descriptive statistics of variables
Results
The initial model included all variables in table 3. Of the variables, only cycling exposure, vehicle flow, residential area, proportion of children aged 14 or below and median household income of the neighbourhoods were significant predictors of the number of bicycle collisions. The final models only included the significant variables, as reported in table 4.
Results from negative binomial models
The activity-based exposure variable is statistically significant at 0.05 level in accounting for the variability in the number of bicycle collisions in both periods. The coefficients of the variable were greater than 0 but less than 1, indicating that the number of bicycle collisions went up but the collision risk decreased with the increasing use of bicycles at a TPU. More precisely, if the volume of cycling doubled at a TPU, the number of bicycle collisions increased by 18% and 14% for the period from 2001 to 2003 and the period from 2010 to 2012, respectively, but the bicycle collision rates decreased by 41% and 43%, respectively. The evidence from this empirical study demonstrates that the SIN phenomenon for bicycle users is also found across TPUs within the city of Hong Kong.
The two models also indicate that five other variables are statistically significant at 0.05 level in explaining for the variability of safety of bicycle users across different TPUs. Notably, it was found that TPUs with higher motor vehicle flow, longer bicycle tracks, more residential land use and more children had greater numbers of bicycle collisions after controlling for bicycle exposure. Last but not least, the median employment income was negatively associated with the number of bicycle collisions, indicating that TPUs where there were more residents with lower socioeconomic status had larger number of bicycle collisions, even controlling for exposure.
Discussion
Exposure is a very important variable for explaining systematic variations in collision frequency. This study is able to control both vehicle and bicycle flows. In particular, by reconstructing the cycling routes of respondents in Geographic Information System (GIS) based on travel survey data, this study is capable of controlling distance travelled by bicycles with a bicycle exposure variable (BDist), which is often difficult to obtain and hence often lacking in cycling safety research.
The exponent of the bicycle flow is about 0.2, much lower than that in most studies evaluating the non-linearity of the risks faced by cyclists (usually between 0.3 and 0.5).1 ,31 If only bicycle exposure is modelled (ie, not including the five control variables), the coefficient is equal to 0.37 and 0.33 in the two periods, respectively, which are comparable with other studies regardless of the spatial scale they used. This suggests that controlling other variables may help better evaluate the effect of bicycle exposure.
Many studies have discussed the reasons behind SIN.1 ,6 ,8 ,12 ,32 A recent study by Jacobsen et al32 discussed three possible reasons for explaining SIN, including safer street regulations, design and operation; changes in behaviour of cyclists; and changes in behaviour of motorists. They suggested that the most likely explanation for SIN was motorist behaviour. It is important to explicit recognise that SIN is a phenomenon but it does not necessarily suggest a casual relationship. Once the statistical association is established, efforts should be made to identify the reasons behind, which may not be the same in different contexts, for promoting cycling safety, especially in areas of low bicycle usage.
Next, the finding that traffic flow is significantly and positively associated with the occurrence of bicycle collision is in accordance with the previous studies such as Geyer et al13 and Wei and Lovegrove.33 The main reason may be related to the complexity of transport systems and the mix of road users. The (positive) coefficient of bicycle tracks indicates that TPUs with cycle tracks have greater number of bicycle collisions even after controlling for bicycle exposure. This finding suggests that the safety risk of fragmented cycle tracks, especially where they interface with vehicular traffic, identified by Loo and Tsui,24 has remained. Very often, cyclists who would like to ride on cycle tracks have to use public roads for linking multiple segments of cycle tracks,24 which increases the chance of being involved in a bicycle–vehicle collision. Consistent with other studies,9 ,24 child cyclists (below 14 years old) are also more likely to be injured in a collision due probably to inadequate cycling skill. The reasons for the negative coefficient of median employment income can be twofold. First, people with higher socioeconomic status may have better knowledge about cycling safety and cycling behaviour. Second, socially deprived area may have fewer resources for installing enough transportation facilities, such as signage, for bicycle users.
It should be pointed out that bicycle collisions in this research were modelled by negative binomial regression, a conventional statistical model that does not account for spatial correlation (ie, values of neighbouring TPU's not being independent). One reason for the choice is that even though a number of advanced spatial statistical models have been developed, negative binomial regression has still been widely used in modelling traffic collisions. Although a failure to correct for spatial correlation probably yields an underestimation of the variance of coefficients, the results of the models have shown that the problem is not severe because the main coefficients were highly significant. Another issue is that the analysis in this study was conducted at the TPU level. However, TPUs are not homogeneous. It is hence worth further exploring SIN at a finer spatial scale like street blocks. In addition, as bicycle counts on roads in Hong Kong are not available, this research employs an activity-based approach to measure cycling exposure based on the travel survey. The results have shown that the estimated bicycle exposure can well explain the occurrence of bicycle collisions in this empirical study. However, in the absence of actual bicycle flow data on roads, the activity-based approach cannot be further validated. Therefore, more research efforts should be dedicated to the validation of this approach in measuring cycling exposure when other bicycle data are available.
Conclusions
This research suggests that the often-claimed dilemma of discouraging cycling to prevent injury of cyclists and encouraging cycling for sustainable transport and health benefits may not necessarily hold. When specific and appropriate measures are in place,1 ,6 ,8 ,12 ,32 it is possible to achieve both the objectives of reducing cycling injury and maximising the health and environmental benefits of cycling in a sustainable transport system.
To examine whether SIN for cyclists applies across different neighbourhoods within the same city, this study conducted a local-level analysis on bicycle collisions in Hong Kong. The results indicate that SIN for cyclists applies to the local level as well within the same city. Even in a highly motorised city like Hong Kong, cyclists are less likely to be involved in road collisions in communities with higher cycling volume. Despite the health benefits from cycling, a model shift from driving to cycling may be greatly hindered by safety concerns. In the travel surveys of Hong Kong,22 ,23 it was found that about 20% of people cited ‘danger to cycle on roads’ as the main reason for not cycling. Cyclists are vulnerable road users and are more likely to be injured than motorists in a traffic collision. Hence, more research efforts should be dedicated to the interventions for protecting cyclists, especially in areas with lower bicycle usage.
What is already known on the subject?
Safety in numbers for cyclists was found mainly using national-level and city-level data.
The above was also found to apply to selected intersections and road segments.
Data on cycling activities are scarce and not comprehensive in most administrations.
What this study adds?
Safety in numbers for cyclists was also found to apply at the local level within the same city.
In Hong Kong, cyclists are less likely to be involved in road collisions in communities with higher cycling volume.
In areas where bicycle volume on roads is not systematically collected, cycling exposure can be estimated from travel surveys.
Gun buybacks endorsed
A US Sherrif views urges the extension of gun buybacks to regional collaborations. A paediatric surgeon added that the cost of such programmes is far less than the cost of treating gunshot wound victims. However, more action is needed at the federal level to reduce trafficking of guns from other states.
Comment: I was pleased to learn that a study has been funded to evaluate the new licensing procedures.
Gun super-owners
There are almost 265 million privately owned guns in the USA and they belong to just 3% of adults. These ‘super-owners’ own between 8 and 140 guns each.
Acknowledgments
The authors thank the Committee on Research and Conference Grants (CRCG) and the Knowledge Exchange (KE) Fund of the University of Hong Kong for funding ‘Can Cycling Training Enhance Cycling Safety in Hong Kong? A Study from the Perspectives of Adolescent Cyclists and Their Parents’ and ‘Promoting Cycling Safety in Hong Kong: Evidences from Adolescent Cycling Training Programme’, respectively. The findings in this paper are directly related to the background research of the above projects.
References
Footnotes
Contributors BPYL identified the research gap, suggested the literature, provided the databases and critically reviewed the data quality and methodology. SY developed the methodology, performed the analysis and drafted the manuscript. BPYL provided comments on earlier drafts, revised the submission and made final approval of the version submitted.
Funding University of Hong Kong (CRCG104003758 and KE002100017).
Competing interests None declared.
Provenance and peer review Not commissioned; externally peer reviewed.
Data sharing statement The data sets are owned and made accessible to the authors from the Hong Kong SAR Government.