Article Text

Abstract
Background Research has suggested that inequalities in risk exposure may help explain identified ethnic inequalities in child pedestrian injury risk. However, addressing risk exposure in epidemiological research presents theoretical and methodological challenges. This article conceptualises the risk of child pedestrian injury as related to both exposure levels (the quantity of time children spend as pedestrians) and the probability of a hazard where that exposure takes place (the quality of the road environment).
Objective To investigate the sensitivity of results on ethnic inequalities in child pedestrian injury risk in London to control for exposure and hazard levels.
Methods Using police records of injury 2000–2009, we modelled the relationship between ethnicity, deprivation and child pedestrian injury rates in London using characteristics of the road environment to control for hazard levels and restricting the analysis to the time of the weekday morning commute (7.00–9.00 am), when most children must make a journey to school, to control for exposure levels.
Results Controlling for risk exposure in this way fundamentally changed the nature of the relationship between ethnicity, deprivation and child pedestrian injury. During the time of the morning commute to school, ‘Black’ children were found to have higher pedestrian injury rates in the least-deprived areas.
Conclusions To inform effective strategies for reducing injury inequality, it is vital that exposure to risk is both acknowledged and considered.
Statistics from Altmetric.com
Background
A number of studies have suggested ethnic differences in road traffic injury risk. While there is no consensus in the international literature about specifically who is at risk, most studies suggest that children from minority ethnic groups have higher pedestrian injury risks than their majority ethnic counterparts,1–6 though a few studies have identified minority ethnic groups at lower injury risk.7 Understanding what these differences mean for injury prevention and other areas of policy and practice is not straightforward, as deconstructing the complex concept of ethnicity poses a challenge for both researchers and policymakers.
Ethnicity is a shifting and multidimensional concept making both definition and measurement problematic. The many components of ethnic identity such as nationality, skin colour, country of origin and religion may have different implications for health. In addition to ethnic identities (indications of how people choose to define themselves or others), structural elements of ethnicity (associations with socioeconomic factors and experiences of racism) may also influence health.8 For research to be useful for policies addressing inequalities in health, it needs to be directed not only at documenting inequalities but also discovering the mechanisms that potentially link identity and structural components of ethnicity with health outcomes such as pedestrian injury events.
In London, home to half of the United Kingdom's ethnic minority population, our previous work reported that pedestrian injury rates among ‘Black’ children are 50% higher than rates among ‘White’ children.9 Theoretically, such observed inequalities potentially arise from artefacts of measurement, as indicators of confounding by other variables (eg, socioeconomic status) or as ‘real’ indicators of a causal relationship between one or more aspects of ethnicity. Despite limitations with the data (eg, under-reporting of road traffic injuries, imperfect measures of ethnicity), these results have been shown to be robust to a number of sensitivity analyses and do not appear to be spurious or easily attributable to a particular bias. In terms of possible confounders, structural associations between deprivation and ethnicity are plausible explanations of these observed inequalities, but we found no evidence of this.9 When the relationship between area deprivation and child pedestrian injury rates was examined separately by an ethnic group, pedestrian injury rates were found to increase with increasing levels of deprivation in ‘White’ and ‘Asian’ children; there was no equivalent relationship between area deprivation and injury risk among ‘Black’ children.9 In other words, while area affluence appears to protect ‘White’ and ‘Asian’ children, ‘Black’ children face higher injury risks across all areas of London.
This presents two epidemiological puzzles: why are ‘Black’ children apparently at higher risk of pedestrian injury than those from other ethnic groups in London? And why is lower area deprivation not associated with lower pedestrian injury rates among ‘Black’ children? This paper explores the role of one set of candidate explanations for casual relationship for injury inequalities: those relating to higher exposure to injury risk as a mechanism.
Accounting for risk exposure, however, is an enduring problem in epidemiological research. Critics of current epidemiological research have argued that definitions of exposure are often inadequately conceptualised. Even when the concept of risk exposure has been sufficiently considered in theory, in practice, measurement difficulties often lead to epidemiologic exposure measures collected ‘due to convenience, availably of data, or convention, rather than based on models of disease process’.10 Child pedestrian injury is a good example of such problems, as pedestrian exposure has multiple components and measurement is challenging.
Risk can be conceptualised as ‘the probability that exposure to a hazard will lead to a negative consequence’.11 Thus, the risk of child pedestrian injury is related to both exposure levels (the quantity of time children spend as pedestrians) and the probability of a hazard where that exposure takes place (eg, the quality of the road environment). The higher rates of injury for ‘Black’ children in London may reflect more time spent as pedestrians than their counterparts, or that the roads where they spend their time are somehow more ‘hazardous’. The large literature on environmental correlates of child pedestrian injury provides some information about the level of hazard in different areas. Evidence suggests that traffic speed, traffic volume, presence of major roads, presence of parked cars, street vendors and rubbish bins are all associated with higher child pedestrian injury rates.12–23 Urban density, presence of minor roads, street curvature (more curved streets) and traffic-calming measures are associated with lower pedestrian injury rates.15 ,19 ,22–24 Controlling for differences in these road environment characteristics therefore provides some control for the probability of a hazard.
There are a number of potential methods for estimating ‘time exposed’, but these all have limitations for examining the range of different exposures to risk. Pedestrian counting methods can determine the volume of pedestrian traffic at particular locations; however, manual methods require high labour costs and automated pedestrian counting devices are generally not capable of collecting information on characteristics such as ethnicity.25 Travel diaries can estimate time or distance walked at a population level, but sampling strategies are typically not designed to be representative of the places where exposure occurs at the population level, and walking trips in particular are subject to under-reporting.26 ,27 Further, walking for transport is only one component of pedestrian exposure levels. Children may also be injured as pedestrians while participating in leisure activities that involve playing or ‘hanging out’ in the road environment, exposures which are typically not collected in travel diaries.
Accounting for exposure and hazard levels, then, presents an additional methodological challenge to studies examining population differences in risk. These types of studies often rely on ecological designs, where even simply calculating injury rates offers difficulties. Some work on social differences in pedestrian injury events calculate injury rates by comparing the number of injuries that occur in an area (numerator) with the resident population (denominator). Other studies use an alternative estimate for the denominator and link injured child pedestrians to the areas in which they live. While the most appropriate method is under debate,28 ,29 neither method is able to adequately account for social differences in exposure levels.
To study the role of exposure in explaining relationships between ethnicity, deprivation and risk, we investigate the sensitivity of results on ethnic inequalities in child pedestrian injury risk in London9 to some important controls for exposure and hazard levels. To control for exposure levels, we restrict analysis to injury events occurring during 7.00–9.00 am on weekdays. Compared with other times and days, this time period is when children are more likely to have similar levels of exposure as pedestrians, as most children of school age, regardless of ethnicity, must make a journey to school. Further, recent evidence suggests that relatively few social and environmental characteristics are salient in predicting ‘doing some walking on the way to school’ compared with ‘doing some walking to other activities’.30 The morning journey to school is also likely to be more direct than journeys at other times of the day. As the morning is often a rushed time for families,31 children may be less likely to play or ‘hang out’ in the road environment on the commute to school. We therefore suggest that the time of the morning commute is a proxy control for the quantity of exposure. To provide some control for hazard levels, we adjust for several known environmental correlates of child pedestrian injury.
Methods
We used an observational study to examine the role of exposure and hazard levels in explaining social differences in child pedestrian injury. We model the relationship between ethnicity, deprivation and injury rates during the time of the morning commute to provide some control for possible ethnic differences in exposure levels, and we adjust for characteristics of the road environment known to be associated with pedestrian injury events to provide some control for possible differences in hazard levels between areas where children from different ethnic groups spend time. The time of the morning commute is not a perfect control for exposure levels, as it is likely that both distance to school and mode of travel vary by social and environmental characteristics. Therefore, this analysis also incorporates data from travel diaries on the social characteristics of mode and distance travelled during the morning commute.
Travel diary data
We obtained an extract of the London Travel Demand Survey (LTDS) 2006–2008, an annual survey of travel patterns representative of all households in Greater London. In a face-to-face interview with a trained interviewer, every member of selected households aged over 5 years was asked to complete a one-day travel diary that recorded the starts, interchanges and ends of every trip on the travel day. ‘Crow fly’ journey distances were estimated using the start-point and end-point of each interchange. Using variables on journey purpose and main mode of travel, we were able to calculate distances and main mode of travel to school for children 5–15 years. We combined data from 3 years of the survey. Between 2006 and 2008, the LTDS collected information on the travel patterns of 1916 ‘White’ children, 690 ‘Black’ children and 641 ‘Asian’ children aged 5–15 years. All analyses were weighted to represent the population during weekday term time and allowed for the stratification of the sample by London borough.
Numerator: injury events
We obtained a dataset of police STATS19 data 2000–2009 that included all reported casualties and collisions occurring in London. Casualties were included in the analysis if aged 0–15 years and injured as pedestrians. We analysed all casualties (occurring at any hour or day) and those occurring between the hours of 7.00 and 9.00 am on weekdays separately. Each casualty was assigned to a lower super output area (LSOA) based on the Ordnance Survey grid reference of the location where the collision occurred. The level of deprivation of each LSOA was scored using the Index of Multiple Deprivation 2004 (IMD).32 The 4765 LSOAs in London were ranked according to IMD score and divided into deciles (1 least deprived to 10 most deprived). Casualties were assigned to the LSOA in which they were injured. We chose to assign casualties in this way as there is evidence that child pedestrians tend to be injured close to home in London33 and in order to maximise the use of available data. A sensitivity analysis was conducted to compare results when assigning casualties to the LSOAs in which they live (the alternative approach to estimating casualty rates).
Denominator: population estimates
To derive population rates, we used mappings reported in previous research9 to assign STATS19 ethnicity categories to aggregated ethnicity groupings used by the Greater London Authority (GLA) drawn from 2001 Census categories. The analysis uses three broad categories of ethnicity, which we have called ‘White’, ‘Black’ and ‘Asian’, based on these mappings. Estimates of resident populations were derived from Census 2001 data. Age-specific population data are not available at the LSOA level by ethnic group, so the population of ‘White’, ‘Black’ and ‘Asian’ children in each LSOA was estimated by multiplying the numbers of children resident in each LSOA by the percentages of residents of all ages that are ‘White’, ‘Black’ or ‘Asian’ (both from the 2001 Census). The estimates of LSOA-level ethnic group child populations were then scaled to sum to the available borough-level total estimates in 2005 (supplied by the GLA) to allow for both population growth and ethnic differences in family size.
Road environment variables
We included available road environment and area characteristic variables found to be associated with injury events in the literature. These included density of road junctions, A roads and minor roads in the LSOA, the proportion of postcodes in an LSOA characterised as ‘business’, the area (in square metres) of an LSOA, average vehicle speeds and traffic flows. To create variables describing the road environment in an LSOA, current road network information from the Integrated Transport Network supplied by Ordnance Survey was overlaid with LSOA boundaries provided by the census in ArcView GIS (manufactured by ESRI). Data on average traffic speed and volume came from the London Greenhouse Gas Inventory (LEGGI). To calculate LSOA summaries of average speeds and volumes, the LEGGI road network was overlaid with LSOA boundaries.
Analysis
Negative binomial multivariable regression models were used to estimate the rate of children of each ethnic group injured as pedestrians in each LSOA at all times of the day, and separately during the time of the morning commute. We estimated injury rate ratios, with 95% CIs, comparing rates in each decile of LSOAs with the rate in the least-deprived decile, adjusting for road environment variables. Robust SEs were estimated that allowed for within-borough correlations in LSOA injury rates. A more detailed discussion of these methods is presented elsewhere (statistical appendix).9 To examine the relative contribution of deprivation and hazard levels to child pedestrian injury rates among ‘Black’, 'White’ and 'Asian’ children, we compared unadjusted injury rates by decile of deprivation with rates adjusted for the road environment characteristics.
Travel diary data on trips to school by main mode of travel were analysed descriptively using tests for heterogeneity across subgroups.
Results
Travel diary data
Data from the LTDS (table 1) suggest differences in the distributions of mode of travel to school according to age (p<0.001), ethnic group (p<0.001), household income (p<0.001), quintile of deprivation (p<0.001), area of London (p<0.001) and vehicle access (p<0.001). Children least likely to travel to school by car are ‘Black’, from the most-deprived areas, living in inner London, from low-income households and households without access to a vehicle. Children more likely to travel to school by bus are older, ‘Black’, from low-income families and households without access to a vehicle. Children more likely to walk to school are younger, ‘Asian’, from low-income households, from households without access to a vehicle, from more deprived areas and living in inner London.
LTDS 2006–2008 percentage of trips to school by main mode of travel
The children who travel furthest to school (table 2) are older, from higher income families, living in less deprived areas and in households with access to a vehicle. ‘Asian’ children have lower mean distances to school compared to their counterparts. ‘Black’ children and children living in outer London appear to have higher median distances to school.
LTDS 2006–2008 reported distances travelled to school (km)
Ethnicity, deprivation and road traffic injury
Between 2000 and 2009, there were 15 508 children aged 0–15 injured as pedestrians on London's roads, of whom 2042 (13%) were injured during the time of the morning commute to school. Ethnicity was recorded for 85% of casualties. On weekday mornings there were 848 ‘White’, 598 ‘Black’ and 217 ‘Asian’ child pedestrian casualties.
Of the 15 508 children injured, location of residence was available for 9044 (58%) casualties. We excluded 190 casualties who were resident outside London, leaving a total of 8854 casualties in our analysis based on location of residence (1261 children injured during the time of the morning commute).
Overall, the average pedestrian injury rate among ‘White’ children was 86 (95% CI 84–88) per 100 000 children during all hours of the day and 1010–11 per 100 000 children during the time of the morning commute. Among ‘Black’ children, the rate was 50% higher compared with ‘White’ children (131; 127–135 per 100 000) during all hours of the day and 85% higher (19; 18–21 per 100 000) during the time of the morning commute. Rates among ‘Asian’ children were lower than those among ‘White’ or ‘Black’ children (65; 63–69 per 100 000 during all hours of the day and 8; 7–9 per 100 000 during the time of the morning commute).
Relationships between ethnicity, deprivation and road traffic injury rates differ during the time of the morning commute compared with at all times of the day (figure 1). For ‘White’ and ‘Asian’ children, the rates increase with increasing levels of deprivation during all times of the day. After taking into account the characteristics of the road environment (figure 2), the relationship during the time of the morning commute between ‘White’ injury rates and deprivation was broadly similar to the relationship during all times of day, although considerably less strong. There did not appear to be a relationship between ‘Asian’ injury rates and deprivation during the time of the morning commute after controlling for the road environment. Among ‘Black’ children, there did not appear to be a relationship between injury rates and deprivation during all times of the day; however, during the time of the morning commute, injury rates appeared to decrease with increasing levels of deprivation. The sensitivity analysis using LSOA of residence as an alternative measure for the denominator found no relationship between deprivation and injury rates among ‘Asian’ and ‘Black’ children, and increasing injury rates with increasing levels of deprivation among ‘White’ children (though CIs are very large) during the time of the morning commute.

Annual child pedestrian injury rates per 100 000 children by decile of deprivation of location of collision, 2000–2009.
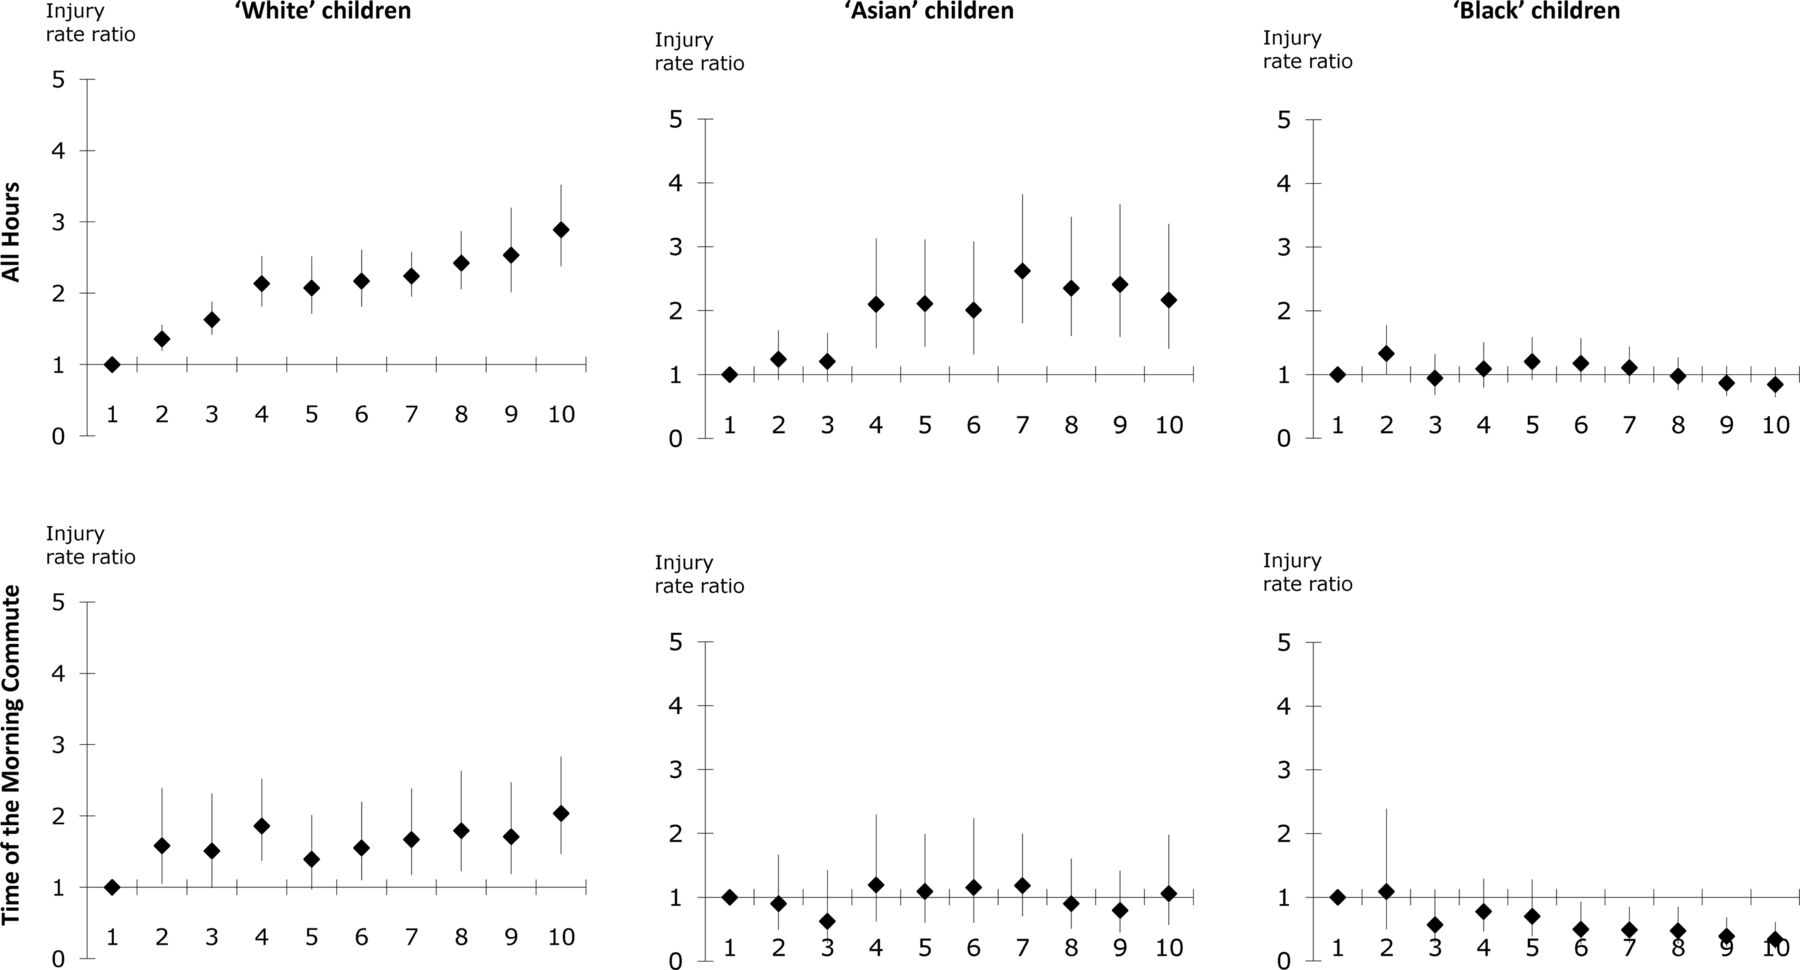
Injury rate ratios comparing pedestrian injury rates by decile of deprivation of location of collision with that in the least-deprived decile (adjusted for road environment variables).
Associations between road environment characteristics and ‘White’, ‘Black’ and ‘Asian’ pedestrian injuries appeared to be relatively similar (table 3). Density of A roads, junction density and proportion of business postcodes are associated with increased pedestrian injury risk among children, while density of minor roads and traffic flows are associated with decreased injury risk. Speed, however, appeared to be associated with increased injury risk in ‘White’ and ‘Asian’ children but decreased risk in ‘Black’ children. Associations between road environment characteristics and injury risk appear similar during the time of the morning commute compared with at all times of day.
Rate ratios showing changes in injury rates associated with change in road environment and area characteristics of LSOAs
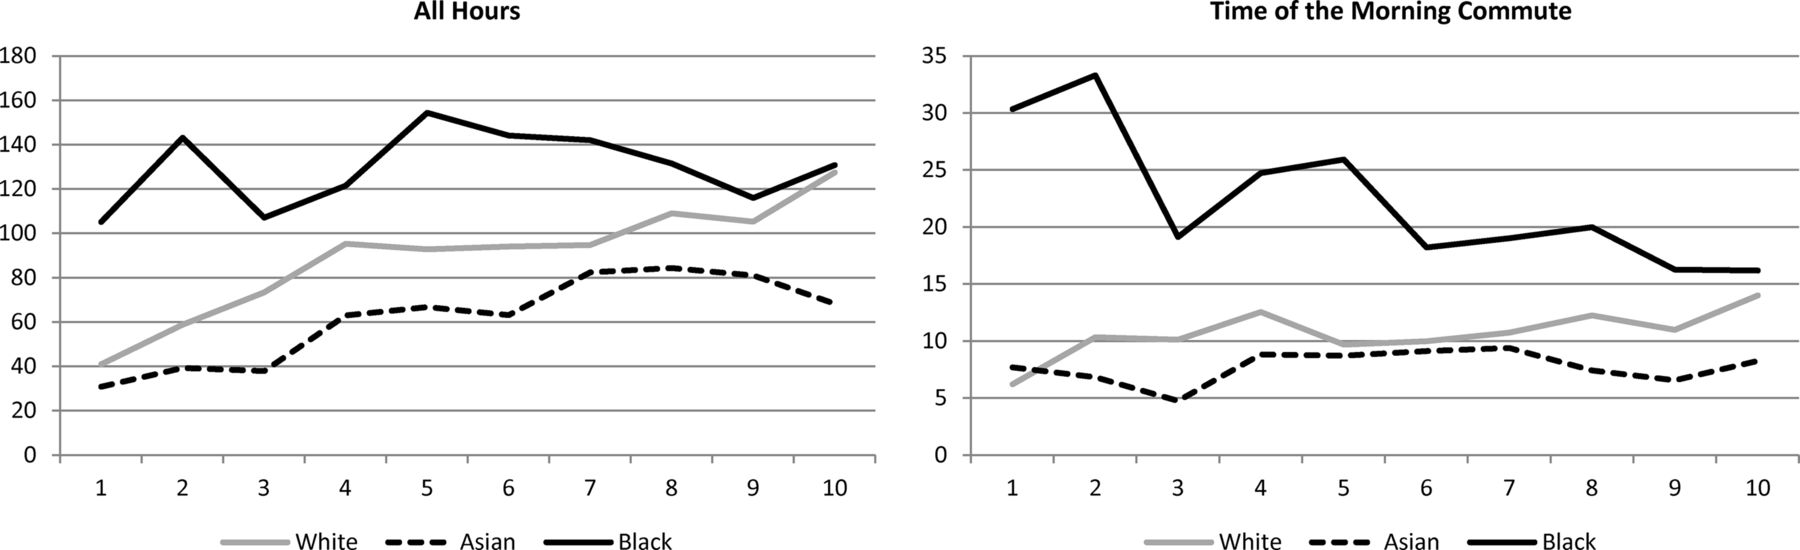
Figure 3 compares unadjusted child pedestrian injury rates by decile of deprivation to rates adjusted for the road environment. The figure suggests that based solely on the road environment characteristics of an area, we would expect to see injury rates increase with increasing levels of deprivation (dotted lines). The difference between the adjusted and unadjusted rates may be interpreted as the impact of deprivation on ‘White’, ‘Black’ and ‘Asian’ child pedestrian injury rates. During all hours of the day, area affluence appears to have a protective effect on pedestrian injury for ‘White’ and ‘Asian’ children (the adjusted rate is higher than the unadjusted rate in deciles 1–3), while high levels of area deprivation appear to have a harmful effect on ‘White’ and ‘Asian’ rates (the unadjusted rate is higher than the adjusted rate in deciles 7–10). For ‘Black children’, area affluence does not appear to have the same protective effect at low levels of deprivation during all hours of the day, and during the time of morning commute, area affluence appears to have a harmful effect. High levels of area deprivation, however, appear to have a protective effect on ‘Black’ child pedestrian injury rates both during the time of the morning commute and during all hours of the day.

Pedestrian injury rates per 100 000 children, unadjusted and adjusted for road environment characteristics.
Discussion
Even after accounting for some indicators of exposure levels, we found that ‘Black’ children in London had higher pedestrian injury rates compared with their ‘White’ and ‘Asian’ counterparts, particularly in less-deprived areas of London. This result may be in part due to our imperfect measures of both hazard and exposure levels. However, results from the LTDS suggest only small differences in exposure levels during the morning commute. ‘Black’ children are more likely to travel by bus, and less likely to travel by car, compared with their counterparts, while ‘Asian’ children are more likely to walk to school. In terms of distance travelled to school, our analysis suggests higher distances to school among ‘Black’ children and lower distances among ‘Asian’ children and children living in relatively deprived areas. These results are consistent with data on secondary school pupils from the Department for Education, which suggest that in London ‘Black’ pupils are more likely to travel more than 3 miles to school, while ‘Asian’ children tend to live closer to school.34
These ethnic differences in travel patterns during the morning commute are relatively small compared with the observed differences in child pedestrian injury rates. The median distance travelled to school among ‘Black’ children is 9% longer than the median distance among ‘White’ children, but injury rates during the time of the morning commute are 85% higher among ‘Black’ children compared with ‘White’ children. While we did find that ‘Black’ children were more likely to use modes of travel that involve some walking (eg, taking the bus) compared with ‘White’ children, evidence suggests that the number of minutes walked on the commute to school (regardless of the main mode of travel) is similar among ‘Black’ and ‘White’ children.30 This suggests that exposure levels cannot completely explain the observed higher pedestrian injury rates among ‘Black’ children.
On hazard levels, we were able to account for some characteristics of the road environment in our analysis. Similar to other studies,12 ,15 ,18 ,19 ,22 ,23 we found density of A roads, junction density and proportion of business postcodes to be associated with increased child pedestrian injury rates, while density of minor roads and traffic flows were associated with decreased rates. We found that area deprivation had an impact over and above that of the road environment and that this impact differed by deprivation level. While our findings that ethnic inequalities in injury rates are largest in less deprived areas of London may seem counterintuitive, our measures of the road environment tell us little about the meaning of being exposed in these environments. Ethnicity may not only be associated with the distance or mode of travel to school, but it may also shape experiences of travelling. It is plausible that being a visible minority (eg, a ‘Black’ child in an affluent area) may change the meaning of being exposed in that environment. Our findings that high levels of deprivation appear to have a protective effect on ‘Black’ child pedestrian injury rates may be evidence of a ‘group density’ effect on health more generally, where ethnic minorities living in an area with a higher proportion of people from a similar ethnic group enjoy better health than those who live in areas with a lower proportion.35 Psychosocial factors, such as stigma and lack of social integration (shared culture, social networks and social capital), may form the mechanism for these types of findings.35 Although it is perhaps more difficult to conceptualise injury risk being mediated by such psychosocial factors, it is plausible that analogous structural mechanisms relating to density or minority status might change the meaning of pedestrian exposure. Speculatively, these might relate to (for instance) whether children are likely to move more, or less, quickly when crossing roads or whether they are more, or less, likely to travel with others. More research is needed on how such social factors might differentially affect exposure type and injury risk across settlements with differing ethnic densities.
Though methodologically challenging, correctly accounting for levels of exposure in risk research has important policy implications, particularly for work that aims to compare risks. The recent debate around the use of the drug ‘ecstasy’ and horse riding highlights this point: Writing in an academic paper,36 David Nutt, the UK government's drug advisor, suggested that taking ecstasy was no more dangerous than horse riding. Comparing the relative ‘dangerousness’ of these activities (rather than comparing the scale of the social problem) relies, to some measure, on how often the target population are exposed to the hazard. Only if we can agree on a measure of risk exposure (eg, hours exposed and number of times the activity is undertaken) and if we know something about the relative levels of exposure (eg, how much time people spend on horses and how often people take ecstasy) can we meaningfully compare the relative risks of the activities.
Our analysis compared risks for different population groups rather than the risks of different activities, but the methodological and social policy questions are similar. Measuring the hazards and exposure levels for child pedestrians has a number of unsolved challenges. We attempted to resolve some of the methodological difficulties of risk exposure measurement by including characteristics of the road environment to control for hazard levels in different areas and restricting our analysis to the time of the morning commute to control for levels of exposure. We found that accounting for risk exposure in this way changed the observed relationship between ethnicity, deprivation and injury risk.
Limitations
Our data sources have some limitations that may have affected our results. Travel diary data often under-represent short walking trips; however, this is unlikely to have affected results on travel to school (typically not a very short trip). In our analysis of injury rates, a weakness of STATS19 is under-reporting of injuries, which may very well differ by ethnicity or area deprivation. However, reporting in London is relatively good compared with the rest of the country37 and this issue will only affect our results on the relationship between ethnicity, deprivation and pedestrian injury if the within-ethnic group propensity to report or record an injury differs by area deprivation. Further limitations of STATS19 data relate to the potential for numerator–denominator bias. Definitions of ethnicity in STATS19 are not easily mapped to definitions of ethnic groups used in the census. We mapped data pragmatically according to previous research,9 which revealed that alternative mappings had little effect on results. Another form of numerator–denominator bias potentially present in our analysis arises from assigning casualties to the area in which they occur rather than to the area in which the child resides. The resident population is only a proxy for the number of children exposed to pedestrian injury risk in that area, and any ethnic differences in distances travelled may mean that our estimates are more valid for some ethnic groups compared with others. Our analysis of travel diary data suggested that ‘Asian’ children tend to travel shorter distances to school compared with other children; however, ‘White’ and ‘Black’ children travel relatively similar distances.
Our results using the location of collision to identify the denominator suggest decreasing levels of pedestrian injury rates during the time of the morning commute with increasing levels of deprivation among ‘Black’ children. However, a sensitivity analysis using the location of residence to identify the denominator found no such relationship. Although the results using the location of residence are based on a much smaller sample size (postcodes are not available for all casualties), the relationship should be interpreted with caution.
Implications
Even if the technical question of how to measure exposure can be answered, important policy questions remain about the meaning of different kinds of exposure for society as a whole. Pedestrian risk exposure, like horse riding, has benefits as well as risks for young people: Indeed, ‘risk’ is unlikely to be the primary framework within which decisions about (say) travelling are made.38 Reducing the quantity of pedestrian risk exposure potentially reduces young people's independence and their levels of healthier and socially desirable ‘active travel’.39 Further, the meanings of differential pedestrian risk exposure are also socially constituted. The greater vulnerability of boys to injury compared with girls, for instance, may be normalised in policy discourse and may rarely be the object of interventions, whereas the greater vulnerability of minority ethnic young people may be problematised. However, if there are policy aims to ameliorate observed ethnic inequalities in injury risk, these findings have some profound implications for policy and practice. Our findings suggest that exposure matters in that the relationship between ethnicity and deprivation changes when we control (to some extent) for non-travel exposure by restricting an analysis to the time of the morning commute (when there is, theoretically, less ‘non-travel’ exposure). However, differences in exposure do not explain all the differences between ethnic groups or the relationship with deprivation. This implies that we need to know far more about the meaning of different kinds of exposure to hazards for different population groups in different areas. Practitioners report that identifying strategies for addressing injury inequality, particularly ethnic inequalities, is challenging40 and current strategies rely largely on targeting particular minority ethnic communities using educational strategies. However, we suggest that a priority is explaining the observed higher risk of Black child pedestrian injuries in affluent areas, where it may be more difficult to target such interventions, as there are less likely to be identifiable ‘communities’. Further, the finding that most road environment variables appear to affect different ethnic groups in similar ways suggests that interventions that reduce the hazards to which children are exposed are likely to reduce risks for all groups without exacerbating inequalities in injury risk.
What is already known on this subject
-
Mortality rates from child pedestrian injuries are higher in less affluent families.
-
Children living in the most deprived areas in London experience pedestrian injury rates nearly three times higher than children living in the least deprived areas.
-
‘Black’ children in London have higher pedestrian injury rates compared with ‘White’ and ‘Asian’ children, which are not explained by the association between ethnicity and deprivation.
What this study adds
-
Incorporating indicators of child pedestrian exposure modifies the relationship between ethnicity, deprivation and injury risk.
-
During the time of the morning commute to school, ‘Black’ children were found to have higher pedestrian injury rates in the least deprived areas.
-
Though methodologically challenging, accounting for exposure in risk research has important policy implications.
Drowning in the UK
Figures in the UK for 2012 show that 0–19-year-olds accounted for 12% of drowning deaths and 51% of children aged 7–11 cannot swim the length of a typical pool unaided. The solution proposed mainly involves learning to swim or swimming in places with lifeguards. The question remains: does swimming proficiency reduce drowning? (Noted by IBP)
Injuries in unregulated trampoline parks
A review of 911 dispatch records shows the danger of trampoline parks. As Gary Smith explains, ‘Trampolines were designed as training devices, not as toys’ and if they are not supervised properly they are often used inappropriately. Two personal injury lawsuits are pending against a large trampoline company. (Noted by IBP)
Acknowledgments
London Travel Demand Survey data were provided by Dale Campbell at Transport for London. The road network used was OS ITN layer supplied by Transport for London under license and is copyright Ordnance Survey. 2001 Census data were supplied with the support of ESRC and are Crown copyright. We are grateful to Chris Grundy for his essential data preparation work and to four anonymous referees for helpful comments on an earlier version of this paper.
References
Footnotes
-
Contributors All authors contributed to the design of the study, analysis of the data, interpretation of results and the writing of the manuscript.
-
Competing interests None.
-
Provenance and peer review Not commissioned; externally peer reviewed.